Data · GOV.UK approved premises list · 2 Nov 2026
Wedding venue hotspots and deserts: how far is the next approved venue?
We measured the distance from every in-date approved wedding venue in England and Wales to its nearest neighbour on the national list. Here is where venues crowd together, where they stand alone, and which postcodes have the most.
Key findings
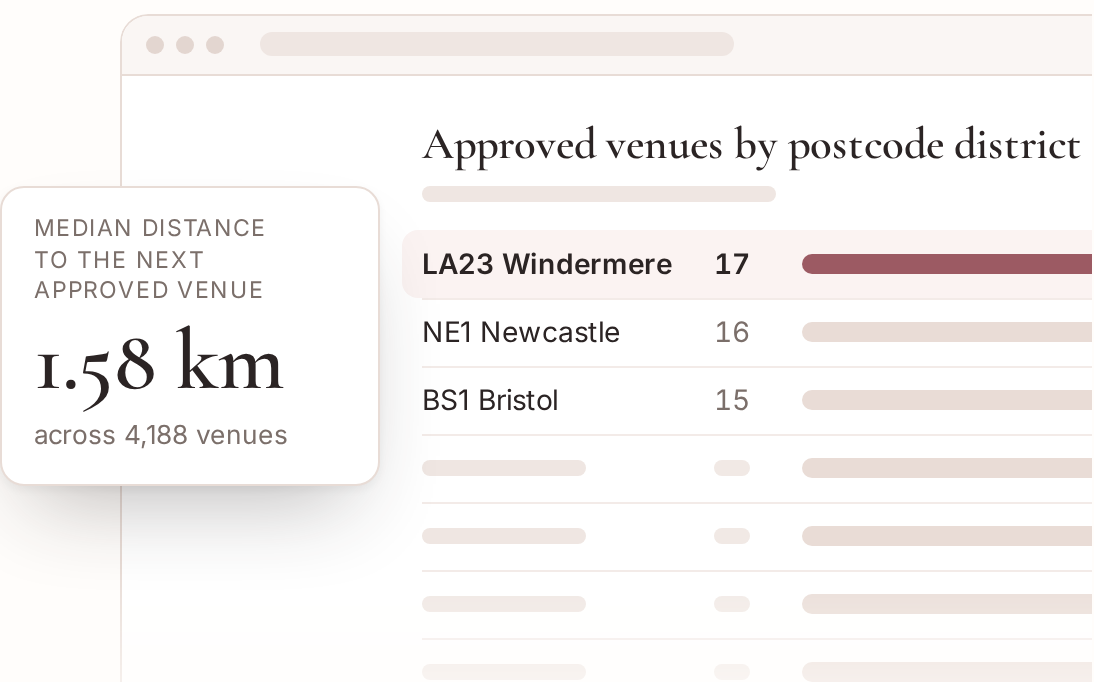
- Half of the 4,188 in-date approved wedding venues we could place on a map are within 1.58 km (0.98 miles) of another approved venue. 38.7% have another within 1 km, 88.7% within 5 km and 99.2% within 10 km.
- The most isolated is The Hive in Westmorland and Furness: the nearest other approved venue, Melmerby Hall, is 17.9 km (11.1 miles) away in a straight line. Next come Nant Y Walch Barn in Powys (17.1 km) and The Brigands Inn in Gwynedd (14.6 km).
- The densest spot is Soho: 43 other approved venues lie within 1 km of The Union Soho, and 197 within 5 km. Outside London, the Manchester and Salford cluster is the tightest, with up to 50 venues inside a 5 km radius.
- The wedding venue postcode with the most approvals is LA23, around Windermere in the Lake District, with 17. It beats central Newcastle (NE1, 16), Bristol (BS1, 15) and Bath (BA1, 14).
- Among the 108 council areas with at least 10 venues, North Lincolnshire is the most spread out (median 4.93 km to the next venue, and none of its 11 has another within 2 km), followed by Central Bedfordshire (3.75 km) and Cumberland (3.68 km). Islington (0.12 km) and Westminster (0.13 km) are the most packed.
- By region, venues in the East of England are the furthest apart (median 2.3 km). London is the closest (0.28 km, with 92.4% of venues having another within 2 km), then the North East (1.05 km).
How close is the nearest other approved venue?
For each of the 4,188 in-date venues with a mappable postcode, we found the closest other in-date venue on the list and measured the straight-line distance between them.
| Another approved venue within | Venues | Share |
|---|---|---|
| 0.5 km | 1,151 | 27.5% |
| 1 km | 1,619 | 38.7% |
| 2 km | 2,382 | 56.9% |
| 5 km | 3,713 | 88.7% |
| 10 km | 4,153 | 99.2% |
| 20 km | 4,188 | 100.0% |
So more than a third of venues have a rival approved venue within a kilometre, often on the same street. 79 full postcodes are shared by two or more approved venues (163 venues in all, up to 3 on one postcode), usually a hotel and its neighbour, or two rooms in one building approved separately.
The most isolated approved venues
These venues are the furthest from any other in-date approved venue. If you want a ceremony venue with no neighbour on the list for miles, start here.
| Venue | Council area | Nearest other approved venue | Distance |
|---|---|---|---|
| The Hive | Westmorland and Furness | Melmerby Hall | 17.9 km (11.1 mi) |
| Nant Y Walch Barn | Powys | Caer Beris Manor | 17.1 km (10.6 mi) |
| The Brigands Inn | Gwynedd | Swyddfa Ardal Meirionnydd | 14.6 km (9.1 mi) |
| The Barns At Upper House | Herefordshire, County of | Brinsop Court Estate | 14.5 km (9.0 mi) |
| The Lodge | Powys | Plas Dinam | 14.3 km (8.9 mi) |
| Frinton On Sea Lawn Tennis Club | Essex | Electric Palace | 13.6 km (8.4 mi) |
| Crug - Glas Country House | Pembrokeshire | The Druidstone Hotel | 13.3 km (8.2 mi) |
| Bombay Sapphire Distillery | Hampshire | Andover Guildhall | 13.1 km (8.1 mi) |
| Elan Valley Country House Hotel | Powys | Hotel Commodore | 12.9 km (8.0 mi) |
| Deer's Leap Retreat | Devon | Duvale Priory | 12.8 km (7.9 mi) |
The densest clusters
Central London has the tightest cluster of approved venues anywhere in England and Wales: private members’ clubs, hotels and livery halls a few streets apart.
| Venue | Council area | Others within 1 km | Others within 5 km |
|---|---|---|---|
| The Union Soho | Westminster | 43 | 197 |
| The Groucho Club Limited | Westminster | 42 | 197 |
| Covent Garden Hotel | Camden | 41 | 200 |
| The Ivy Club | Westminster | 41 | 199 |
| Century Club | Westminster | 40 | 197 |
| Royal Society Of Arts | Westminster | 39 | 200 |
Outside London the busiest 5 km circles are in Salford and Manchester, where venues such as Hemsley House, Salford Lads And Girls Club, The Black Friar, Abode Manchester each have 49 to 50 other approved venues within 5 km.
Postcode districts with the most approved venues
A postcode district is the first half of a postcode, such as LA23 or BS1. Rural honeypots sit beside city centres at the top.
| Postcode district | Main town on the list | Council area | In-date venues |
|---|---|---|---|
| LA23 | Windermere | Westmorland and Furness | 17 |
| NE1 | – | Newcastle upon Tyne | 16 |
| BS1 | Bristol | Bristol, City of | 15 |
| BA1 | Bath | Bath and North East Somerset | 14 |
| M3 | – | Manchester | 14 |
| WA16 | Knutsford | Cheshire East | 13 |
| SW7 | – | Kensington and Chelsea | 13 |
| CH1 | Chester | Cheshire West and Chester | 13 |
| CB2 | Cambridge | Cambridgeshire | 13 |
| BH20 | Wareham | Dorset | 13 |
| SE10 | – | Greenwich | 12 |
| BD23 | Skipton | North Yorkshire | 12 |
| BB7 | Clitheroe | Lancashire | 12 |
| CV37 | Stratford Upon Avon | Warwickshire | 12 |
| BN1 | Brighton | Brighton and Hove | 11 |
| GL7 | Cirencester | Gloucestershire | 11 |
| LD3 | Brecon | Powys | 11 |
| DT2 | Dorchester | Dorset | 11 |
| SE1 | – | Southwark | 11 |
| BA2 | Bath | Bath and North East Somerset | 10 |
By region: median distance to the next venue
| Region | In-date venues mapped | Median km to next venue | Share with another within 2 km |
|---|---|---|---|
| East of England | 449 | 2.3 | 47.0% |
| West Midlands | 288 | 2.12 | 47.2% |
| East Midlands | 301 | 2.04 | 47.2% |
| South West | 655 | 1.94 | 51.5% |
| South East | 694 | 1.86 | 52.7% |
| Yorkshire and The Humber | 369 | 1.83 | 52.0% |
| Wales | 326 | 1.77 | 53.1% |
| North West | 531 | 1.3 | 64.2% |
| North East | 153 | 1.05 | 61.4% |
| London | 422 | 0.28 | 92.4% |
Most spread out and most packed council areas
Council areas with at least 10 in-date venues, ranked by the median distance from each venue to its nearest approved neighbour.
Most spread out
| Council area | Venues | Median to next | Another within 2 km |
|---|---|---|---|
| North Lincolnshire | 11 | 4.93 km | 0.0% |
| Central Bedfordshire | 12 | 3.75 km | 33.3% |
| Cumberland | 38 | 3.68 km | 28.9% |
| Gwynedd | 21 | 3.64 km | 38.1% |
| Somerset | 51 | 3.63 km | 11.8% |
| Staffordshire | 41 | 3.63 km | 34.1% |
| Herefordshire, County of | 26 | 3.5 km | 34.6% |
| East Riding of Yorkshire | 29 | 3.22 km | 31.0% |
| Bridgend | 10 | 3.2 km | 10.0% |
| Devon | 97 | 3.15 km | 30.9% |
Most packed
| Council area | Venues | Median to next | Another within 2 km |
|---|---|---|---|
| Islington | 15 | 0.12 km | 100.0% |
| Westminster | 76 | 0.13 km | 100.0% |
| City of London | 28 | 0.16 km | 100.0% |
| Kensington and Chelsea | 27 | 0.17 km | 100.0% |
| Camden | 30 | 0.19 km | 100.0% |
| York | 22 | 0.2 km | 81.8% |
| Blackpool | 12 | 0.24 km | 91.7% |
| Bury | 10 | 0.25 km | 100.0% |
| Hackney | 15 | 0.26 km | 100.0% |
| Bristol, City of | 29 | 0.26 km | 96.6% |
Somerset stands out among big rural counties: only 11.8% of its 51 mapped venues have another approved venue within 2 km. York is the exception among cathedral cities, with a median of just 0.2 km.
All 108 council areas with 10 or more venues
| Council area | Region | Venues mapped | Median km to next | Max km to next | Another within 2 km |
|---|---|---|---|---|---|
| Barnsley | Yorkshire and The Humber | 10 | 1.18 | 3.8 | 70.0% |
| Bath and North East Somerset | South West | 27 | 0.33 | 4.1 | 70.4% |
| Birmingham | West Midlands | 10 | 0.33 | 2.5 | 80.0% |
| Blackpool | North West | 12 | 0.24 | 2.9 | 91.7% |
| Bournemouth, Christchurch and Poole | South West | 32 | 0.35 | 4.3 | 87.5% |
| Bradford | Yorkshire and The Humber | 20 | 0.99 | 4.0 | 75.0% |
| Bridgend | Wales | 10 | 3.2 | 4.8 | 10.0% |
| Brighton and Hove | South East | 18 | 0.65 | 4.4 | 88.9% |
| Bristol, City of | South West | 29 | 0.26 | 3.1 | 96.6% |
| Bromley | London | 11 | 2.57 | 3.4 | 36.4% |
| Buckinghamshire | South East | 36 | 2.51 | 7.4 | 41.7% |
| Bury | North West | 10 | 0.25 | 1.6 | 100.0% |
| Calderdale | Yorkshire and The Humber | 16 | 1.38 | 6.5 | 81.2% |
| Cambridgeshire | East of England | 83 | 0.91 | 9.3 | 63.9% |
| Camden | London | 30 | 0.19 | 1.6 | 100.0% |
| Cardiff | Wales | 23 | 0.48 | 3.3 | 82.6% |
| Carmarthenshire | Wales | 28 | 2.4 | 6.2 | 46.4% |
| Central Bedfordshire | East of England | 12 | 3.75 | 6.6 | 33.3% |
| Ceredigion | Wales | 14 | 2.05 | 12.2 | 50.0% |
| Cheshire East | North West | 47 | 1.59 | 5.4 | 59.6% |
| Cheshire West and Chester | North West | 45 | 1.37 | 5.8 | 73.3% |
| City of London | London | 28 | 0.16 | 0.5 | 100.0% |
| Conwy | Wales | 17 | 1.33 | 8.6 | 64.7% |
| Cornwall | South West | 135 | 1.66 | 10.7 | 57.0% |
| County Durham | North East | 17 | 2.04 | 7.9 | 47.1% |
| Coventry | West Midlands | 12 | 1.14 | 3.4 | 83.3% |
| Cumberland | North West | 38 | 3.68 | 12.0 | 28.9% |
| Denbighshire | Wales | 16 | 1.31 | 9.5 | 75.0% |
| Derbyshire | East Midlands | 62 | 2.7 | 11.0 | 33.9% |
| Devon | South West | 97 | 3.15 | 12.8 | 30.9% |
| Doncaster | Yorkshire and The Humber | 15 | 2.34 | 7.1 | 46.7% |
| Dorset | South West | 88 | 1.72 | 8.5 | 51.1% |
| East Riding of Yorkshire | Yorkshire and The Humber | 29 | 3.22 | 10.8 | 31.0% |
| East Sussex | South East | 70 | 0.97 | 6.7 | 70.0% |
| Essex | East of England | 87 | 2.61 | 13.6 | 34.5% |
| Gloucestershire | South West | 62 | 1.95 | 6.4 | 53.2% |
| Greenwich | London | 21 | 0.44 | 2.1 | 95.2% |
| Gwynedd | Wales | 21 | 3.64 | 14.6 | 38.1% |
| Hackney | London | 15 | 0.26 | 1.3 | 100.0% |
| Hammersmith and Fulham | London | 11 | 0.67 | 1.1 | 100.0% |
| Hampshire | South East | 96 | 1.94 | 13.1 | 52.1% |
| Herefordshire, County of | West Midlands | 26 | 3.5 | 14.5 | 34.6% |
| Hertfordshire | East of England | 60 | 2.31 | 6.5 | 41.7% |
| Isle of Wight | South East | 24 | 1.69 | 7.6 | 58.3% |
| Islington | London | 15 | 0.12 | 1.5 | 100.0% |
| Kensington and Chelsea | London | 27 | 0.17 | 0.8 | 100.0% |
| Kent | South East | 145 | 2.08 | 10.4 | 44.8% |
| Kingston upon Hull, City of | Yorkshire and The Humber | 10 | 0.77 | 4.6 | 80.0% |
| Kirklees | Yorkshire and The Humber | 20 | 2.01 | 5.5 | 50.0% |
| Lambeth | London | 13 | 0.28 | 1.8 | 100.0% |
| Lancashire | North West | 122 | 1.32 | 9.6 | 65.6% |
| Leeds | Yorkshire and The Humber | 28 | 1.38 | 8.4 | 60.7% |
| Leicestershire | East Midlands | 45 | 2.27 | 8.9 | 37.8% |
| Lincolnshire | East Midlands | 76 | 2.76 | 9.1 | 46.1% |
| Liverpool | North West | 19 | 0.3 | 2.9 | 84.2% |
| Manchester | North West | 42 | 0.28 | 3.2 | 92.9% |
| Monmouthshire | Wales | 18 | 1.52 | 6.9 | 61.1% |
| Newcastle upon Tyne | North East | 31 | 0.28 | 1.9 | 100.0% |
| Newport | Wales | 10 | 0.52 | 4.2 | 70.0% |
| Norfolk | East of England | 107 | 2.37 | 12.1 | 46.7% |
| North East Lincolnshire | Yorkshire and The Humber | 12 | 0.59 | 5.0 | 75.0% |
| North Lincolnshire | Yorkshire and The Humber | 11 | 4.93 | 7.2 | 0.0% |
| North Northamptonshire | East Midlands | 22 | 1.5 | 8.3 | 63.6% |
| North Somerset | South West | 14 | 2.06 | 8.1 | 50.0% |
| North Tyneside | North East | 11 | 0.8 | 2.7 | 54.5% |
| North Yorkshire | Yorkshire and The Humber | 127 | 3.11 | 12.2 | 33.1% |
| Northumberland | North East | 52 | 3.12 | 11.0 | 32.7% |
| Nottingham | East Midlands | 10 | 1.47 | 3.1 | 90.0% |
| Nottinghamshire | East Midlands | 39 | 2.28 | 11.2 | 43.6% |
| Oxfordshire | South East | 60 | 2.29 | 8.6 | 38.3% |
| Pembrokeshire | Wales | 36 | 2.64 | 13.3 | 38.9% |
| Plymouth | South West | 20 | 0.37 | 2.6 | 90.0% |
| Portsmouth | South East | 13 | 0.47 | 3.8 | 84.6% |
| Powys | Wales | 45 | 1.8 | 17.1 | 53.3% |
| Richmond upon Thames | London | 17 | 0.43 | 2.5 | 94.1% |
| Salford | North West | 15 | 0.79 | 5.3 | 80.0% |
| Sefton | North West | 19 | 0.57 | 3.1 | 84.2% |
| Sheffield | Yorkshire and The Humber | 28 | 0.5 | 4.4 | 78.6% |
| Shropshire | West Midlands | 53 | 2.78 | 9.8 | 34.0% |
| Slough | South East | 11 | 0.98 | 2.6 | 90.9% |
| Solihull | West Midlands | 13 | 0.93 | 4.4 | 69.2% |
| Somerset | South West | 51 | 3.63 | 8.4 | 11.8% |
| South Gloucestershire | South West | 12 | 2.49 | 6.7 | 33.3% |
| Southwark | London | 14 | 0.51 | 1.2 | 100.0% |
| Staffordshire | West Midlands | 41 | 3.63 | 10.0 | 34.1% |
| Suffolk | East of England | 72 | 2.28 | 8.4 | 45.8% |
| Surrey | South East | 56 | 2.18 | 5.8 | 44.6% |
| Swansea | Wales | 23 | 0.84 | 6.9 | 60.9% |
| Swindon | South West | 12 | 1.46 | 3.8 | 58.3% |
| Torbay | South West | 10 | 1.31 | 5.8 | 60.0% |
| Tower Hamlets | London | 15 | 0.31 | 1.1 | 100.0% |
| Vale of Glamorgan | Wales | 18 | 0.81 | 4.9 | 66.7% |
| Wakefield | Yorkshire and The Humber | 13 | 1.16 | 5.5 | 76.9% |
| Waltham Forest | London | 14 | 0.35 | 3.6 | 92.9% |
| Wandsworth | London | 18 | 0.29 | 1.1 | 100.0% |
| Warwickshire | West Midlands | 59 | 2.25 | 8.3 | 45.8% |
| West Berkshire | South East | 21 | 2.36 | 7.9 | 28.6% |
| West Northamptonshire | East Midlands | 29 | 1.35 | 6.7 | 51.7% |
| West Sussex | South East | 73 | 2.48 | 6.0 | 42.5% |
| Westminster | London | 76 | 0.13 | 0.8 | 100.0% |
| Westmorland and Furness | North West | 71 | 1.06 | 17.9 | 59.2% |
| Wigan | North West | 14 | 1.09 | 3.3 | 78.6% |
| Wiltshire | South West | 64 | 2.83 | 10.5 | 45.3% |
| Windsor and Maidenhead | South East | 24 | 1.07 | 3.2 | 79.2% |
| Wokingham | South East | 11 | 1.44 | 3.4 | 81.8% |
| Worcestershire | West Midlands | 45 | 1.51 | 8.6 | 55.6% |
| Wrexham | Wales | 12 | 1.99 | 11.6 | 50.0% |
| York | Yorkshire and The Humber | 22 | 0.2 | 5.2 | 81.8% |
What it means if you are planning a wedding
If you love a venue that turns out to be booked, there is usually another approved venue close by: for half of venues the next one is under 1 mile away. In the most spread-out areas, such as North Lincolnshire, Cumberland and Gwynedd, plan travel for guests between ceremony and reception if they are at different places. Browse every approved venue by county or council area, or check an approval’s end date on our approvals ending soon page.
Methodology
- Venues: GOV.UK, “Civil marriages and partnerships: approved premises list” (data table, file last updated 17 October 2025). Contains public sector information licensed under the Open Government Licence v3.0.
- In date: an entry counts if the approval end date on the list is on or after 2 Nov 2026: 4,218 venues. We did not change or estimate any date.
- Location: each venue’s postcode was matched to its postcode centre point and council area using ONS geography via postcodes.io. 30 in-date venues could not be placed and are left out of the distance figures, which cover 4,188 venues. 19 had no postcode we could read and are left out of the postcode district counts.
- Distance: great-circle (straight-line) distance between postcode centre points, Earth radius 6,371 km. Road distances are longer. Venues that share a postcode are 0 km apart.
- Neighbours: only other in-date venues on the national list count. Register offices and religious buildings, which do not need this approval, are not on the list.
Cite this data
Approved Venues (2026), “Wedding venue hotspots and deserts: how far is the next approved venue?”, https://approvedvenues.co.uk/guides/wedding-venue-hotspots-2026, analysis of the GOV.UK approved premises list (updated 17 October 2025), status as at 2 Nov 2026. You are welcome to reuse the figures, CSVs and chart with a link to this page. Questions or corrections: hello@approvedvenues.co.uk.